Independent and dependent variables in verbal, equations, tables and graphs
Understandings:
- Understand what’s a variable,
- Understand the difference between dependent and independent variables.
- Understand how to identify the independent variable and the dependent variable from word problems, tables, and graphs.
- Understand how to represent and analyze quantitative relationships between dependent and independent variables
Essential Questions:
- Why do we use-dependent and independent variables to help solve problems?
Vocabulary:
Variable, is a symbol, such as x, used to describe any number (represents an unknown value). Example 2 x + 7= 15
Coefficient, is a number used to multiply a variable.
Constant, is a value that doesn’t change
Term, is a single mathematical expression
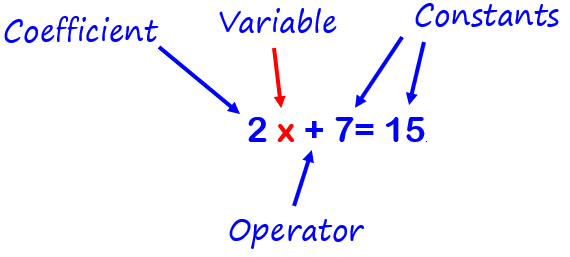
Algebraic Expression, is a combination of constants and variables, connected by signs of fundamental operations (+, -, ×, ÷).
Both sides of an equation are expressions. Expressions don’t contain equality or inequality symbols.
Evaluate, means solve (is to find the value of a numerical or algebraic expression)
Dependent Variable, depends on an independent variable.
Independent Variable, its value can be set arbitrarily to get a result.
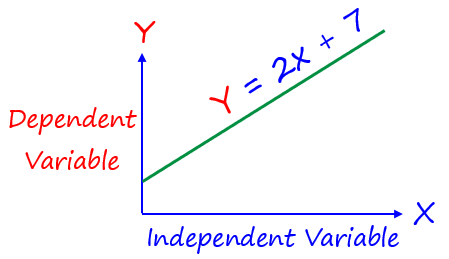
Independent variables are graphed on the x-axis
Dependent variables are graphed on the y-axis
A dependent variable DEPENDS on the independent variable
In the equation y = 2 x+7, the dependent variable is y. The value of y depends on the value chosen for x.
In the formula for the circumference of a circle C = 2πr
r is the independent variable, its value determines the value of C, the circumference (dependent variable).
Mathematical relationships can be represented and analyzed using tables and graphs.
Function — is a rule that shows a relationship between two quantities. A function relates an input to an output.
Input— is the independent variable. The input is the x -value.
Output— is a dependent variable (the solution to the equation). The output is the y-value.
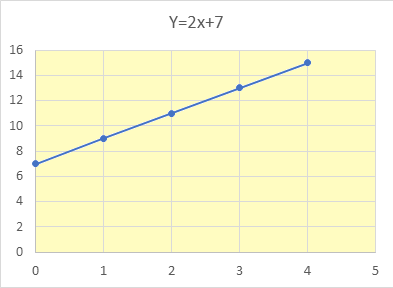
| Input X | Output Y |
| 0 | 7 |
| 1 | 9 |
| 2 | 11 |
| 3 | 13 |
| 4 | 15 |
The first (left) column is the input (independent variable)
The second (right) column is the output (dependent variable).
Example:
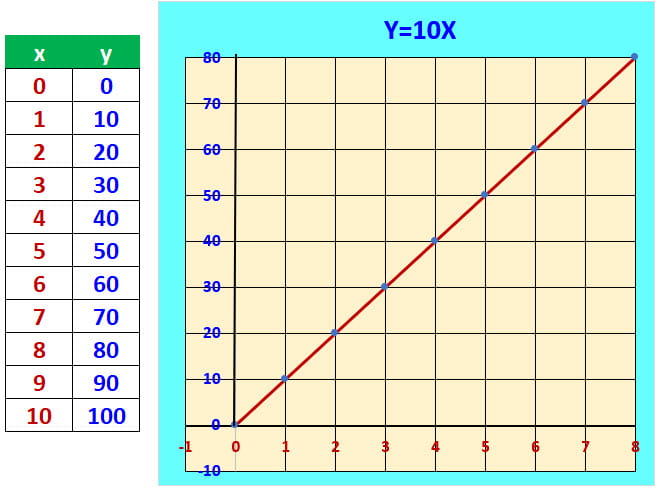
My dad earns $10 per hour. How much money he earns per day will depend on how many hours he works.
The hours worked, X, is the independent variable or quantity. The money earned, Y, is the dependent variable or quantity.
The relationships between independent and dependent variables can be shown in equation, table, and graph form.