
Analyzing data: mean, median, mode, range, IQR; dot plots, stem & leaf plots; histograms; box plots; percent bar graph
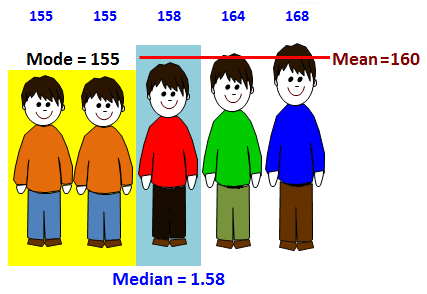
Mean. The average. (1) Add all the numbers (2) Divide the sum by the amount (how many) of numbers given.
Median. Order the numbers, and then find the middle. If 2 numbers are in the middle add and divide by 2.
Mode.The number that occurs most frequently
(Repeat the most)
Range. Subtract the largest minus the smallest. (Max – Min)

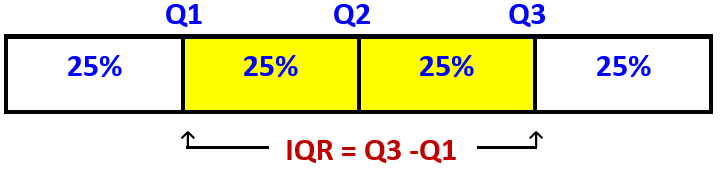
Quartiles in statistics are values that divide your data into quarters.
Q1. The lowest 25% of numbers.
Q2. The next lowest 25% of numbers (up to the median).
Q3. The second highest 25% of numbers (above the median).
Q4. The highest 25% of numbers.
IQR. The interquartile range
IQR is the difference between the first quartile and the third quartile of a set of data.
Measure and Representation of Data
To get a sense of the data’s distribution we use the five statistical summaries:
the (1) minimum, (2) maximum, (3) median (or second quartile), (4) the first quartile, and (5) the third quartile.
Example, Test scores: 60,70,70,70,85,85,85,90,100
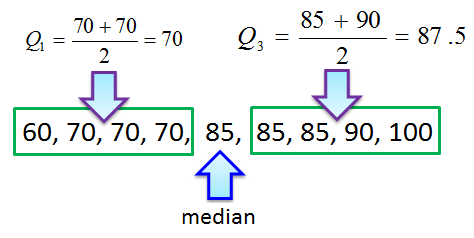
Population size: 9
Median: 85
Minimum: 60
Maximum: 100
First quartile: 70
Third quartile: 87.5
Interquartile Range: 17.5
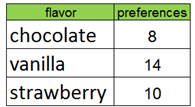
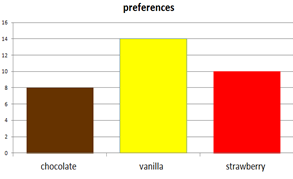
Bar Graphs:
Histogram
A special kind of bar graph that displays the frequency of data that has been organized into equal number groupings. The number groupings cover all possible values of data, therefore there are no spaces between the bars.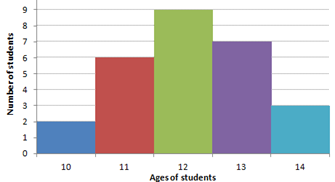
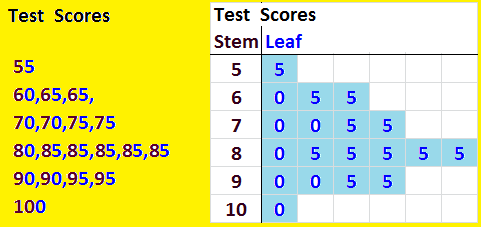
Stem-Leaf Plot
A Stem and Leaf Plot is a type of graph that is similar to a histogram but shows individual values.
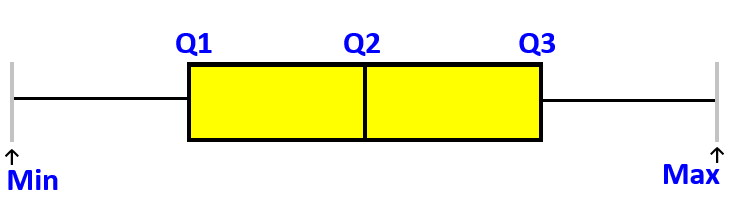
Box Plots
A Box plot is a graphical representation of statistical data, that shows the minimum, first quartile, median, third quartile, and maximum. (sometimes is called a box-and-whisker plot).
Vocabulary:
Data, is the raw information from which statistics are created, (facts or numbers from which conclusions can be drawn).
Mean (“x-bar”) is the AVERAGE of a set of data (add all the numbers and divide by how many.
Median is the number in the “middle” when they are lined up in order. If there are two middle numbers, calculate the median by taking their average (mean).
Mode, (the most common) is the value that occurs the MOST in the set of data (we can have no mode, 1 mode, or more than 1 mode)
Range, is the difference between the smallest and largest values in a set of data
Outlier, is a number that does not fit in with others in its group.
Essential Questions:
- In what ways can sets of data be represented by statistical measures?
- How can you collect, organize, and display data?
- Why is data collected and analyzed?
- How do people use data to influence others?
- How can predictions be made based on data?
Learning Targets:
- Identify statistical questions
- Explain how data answers statistical questions
- Describe a statistical data set using the center, spread, and shape.
- Compare a measure of the center with a measure of variation.
- Summarize and describe distributions
- Summarize numerical data sets.
- Communicate numerical data on a number line (dot plots, histograms, and box plots).
- Analyze the relationship between measures of center and the data distribution.
Students will understand:
• How to analyze sets of data
• How to interpret and graphically represent frequency distributions
• How to represent data sets both qualitative and quantitative
• How to identify and interpret measures of central tendency
• How to analyze and interpret measures of variation
• How to utilize measures of position to represent and interpret data sets