
Objective:
SWBAT interpret numeric data summarized in dot plots, stem-and-leaf plots, histograms, and box plots.
(SWBAT, Students Will Be Able To…)
Lesson Plan:
6.13 Data Analysis
Standards:
6.13(A) Interpret numeric data summarized in dot plots, stem-and-leaf plots, histograms, and box plots; and
6.13(B) Distinguish between situations that yield data with and without variability
6th Grade STAAR Standards Snapshot
Review:
6th Grade Unpacked Math TEKS.docx page 59
Warm-up – Daily Review.
Vocabulary:
6th Grade Mathematics – Vocabulary
Guided Practice.
Guided practice of the skill, to practice the key concepts of the lesson, and to build students’ understanding of the content. Warm-up – Daily Review. Math videos & Skill Builders from my blog (to be completed as homework if not completed in class). 5E Model of Instructional Procedures: (Engage, Explore, Explain, Extend/Elaborate, Evaluate)
I DO… (You Watch)
*
STAT022 Interpreting Histograms
You can view more of my math videos in my YouTube channel
WE DO…(Together)
*
*
YOU DO… (I watch/guide)
Summarizing data using dot plots: GR28
Reading Histograms: GR20
Reading Stem-and- Leaf Plots: GR36 GR37
Reading Box and Whisker Plots: GR40 GR41
Hands-on, online curriculum aligned math worksheets that automatically tracks student progress.
Differentiation:
Accommodations for instruction will be provided as stated on each student’s (IEP) Individual Education Plan for special education, 504, at risk, and ESL/Bilingual. Differentiation will be through small groups, visuals, use of calculators, extra time, supplemental aids and reteach if necessary.
Homework:
Journal:
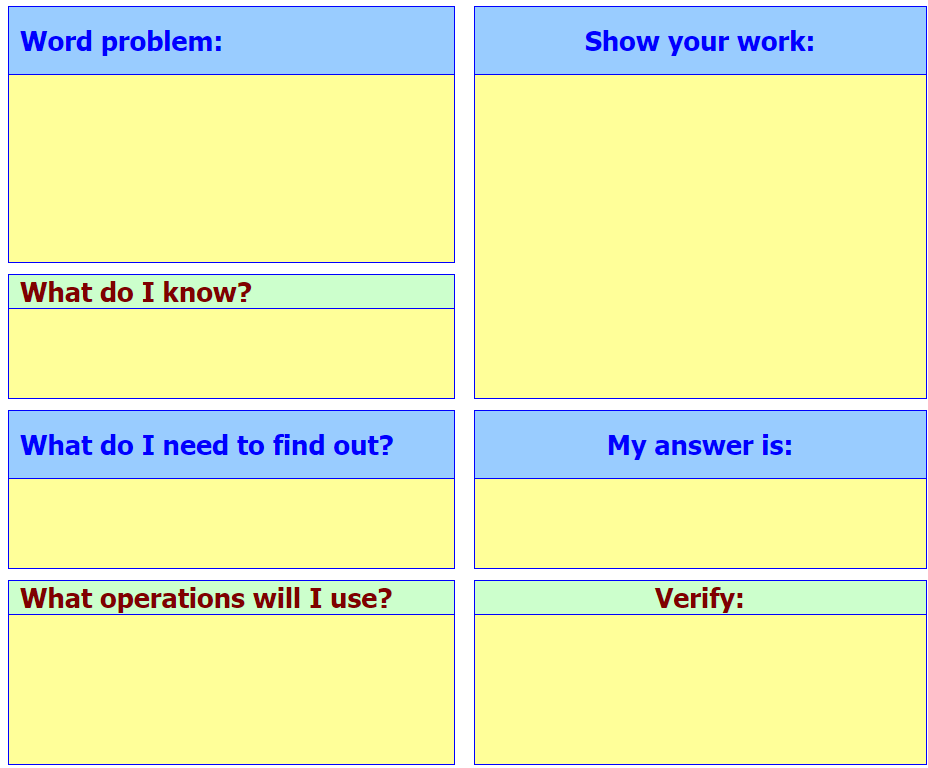
· Write in your journal about how to collect, to interpret, analyze and display data.
· What is statistical data?
· What conclusions can be drawn from data?
· How do I choose and create appropriate graphs to represent data?