Multiplicative Relationship
Many real-life situations involve 2 variable quantities in which one quantity depends directly on the other. Suppose for example that today I went to the gas station, and I saw that a gallon of gas costs 3 USD. I can use the equation Y=3X to calculate what price I should pay.
The equation Y=3X handles 2 variables, X which is the number of gallons of gas and Y which is the price to pay. The value of Y depends on the value of X (the number of gallons). If I buy 1 gallon I must pay $ 3 , if I buy 5 gallons I must pay $ 15, if I buy 10 gallons, I must pay $ 30.
A variable that depends on the value of another variable is called a dependent variable. In this case y is the dependent variable and x is the independent variable. The equation shows the relationship between the variables. It is a multiplicative relationship. To calculate the value of y we must multiply the value of x by 3. The 2 variables are related by a proportional relationship. The value of one variable is in direct proportion to the value of the other.
There are several ways to show how the variables are related. We can use an equation, a verbal description (rule), tables and graphs.
The equation is: “y = 3 x”
The rule is “y is worth 3 times what x is worth“.
The table is:
| X | Y |
| 0 | 0 |
| 5 | 15 |
| 10 | 30 |
| 15 | 45 |
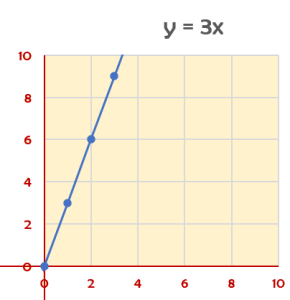
If the amounts from the table above are graphed (number of gallons, price), the pairs (0,0), (5,15), (10,30) and (15,45) will form a straight line through the origin, indicating that these pairs are in a proportional relationship.
The chart is:
The price is the number of gallons multiplied by 3. The equation is Y=3x. The two quantities are in a proportional relationship. The coefficient of X (the independent variable) is the unit rate, which is also the constant of proportionality. The constant of proportionality is 3.
Y is the dependent variable since its value depends on the value of the variable X.
The independent variable is graphed on the x-axis; the dependent variable is graphed on the y-axis.
The graph of a proportional relationship is always a straight line passing through the origin.
Additive Relationship
Example:
A removable dumbbell consists of several iron plates that are attached to a handle. The handle weighs 3 pounds. If we want to know the total weight of the dumbbell, we must add 3 to the weight of the plates.
The rule is: “Y is equal to X plus 3”. Y is the dependent variable since its value depends on the value of the variable X. (Y is the total weight of the dumbbell)
The equation is: “Y=X+3”
The table is:
| X | Y |
| 0 | 3 |
| 5 | 8 |
| 10 | 13 |
| 15 | 18 |
This table shows an additive relationship between x and y, represented with y = x + 3
Additive relationships mean you add the SAME number to any x-value to get the corresponding y-value.
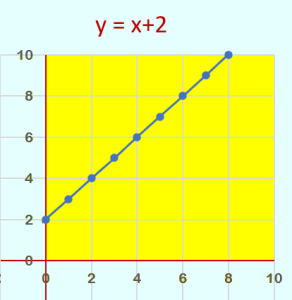
The chart is:
The independent variable is graphed on the x-axis; the dependent variable is graphed on the y-axis.
In an additive relationship, the origin (0,0) is not represented in the table and the graph.
Linear Relationship
A linear relationship is any relationship between two variables that creates a line when graphed in the x y-plane.
In a linear relationship, the equation can have up to two variables. All the variables in the equation are to the first power (their coefficient need not necessarily be an integer; it may be a decimal or a fraction, and not zero in the denominator [because division by zero is undefined]). The equation must graph as a straight line.
Linear relationships can be expressed either in a table of values, a chart or as a mathematical equation of the form y = mx + b.
Types of Linear Relationship
1) Additive Relationship (Simple Addition or Subtraction)
E.g. y = x +3, y = x -1, y = x , etc.
2) Multiplicative Relationship (Simple Multiplication or Division)
E.g. y = 3x, y = -2x, y = ½ x, etc.
3) Multiplicative and Additive Relationship (y = mx + b, slope intercept form)
E.g. y = 2x + 2, y = -x + 3, y = 3x -5, etc.
Linear equation: y = mx + b
X is the input variable, Y is the output variable, m is the slope (constant rate of change), b is the y-intercept.
Linear Equations Represent Lines
The equation y = mx + b describes a straight line on the graph.
Multiplicative and Additive Relationship (y = mx + b)
A plumber has a call out fee of $50 and then charges $10 per hour. What will be the total cost for X hours of work?
Answer:
Slope (m): rate per hour = 10
Fixed amount (b): Initial charge = 50
Independent Variable: Number of hours = X
Dependent Variable: Cost of service = Y
Write an equation in slope-intercept form (y=mx + b) , to work out the total cost for any number of hours worked.
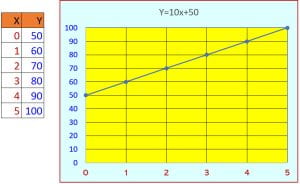
The equation is: y=10x+50
The rule is: “Y is equal to ten times X plus 50”. Y is the dependent variable since its value depends on the value of the variable X.
The table is: The chart is:


